
Alright, before we jump into experimenting the Probability Density Function, to use this toolkit effectively, you can follow the rules below:-
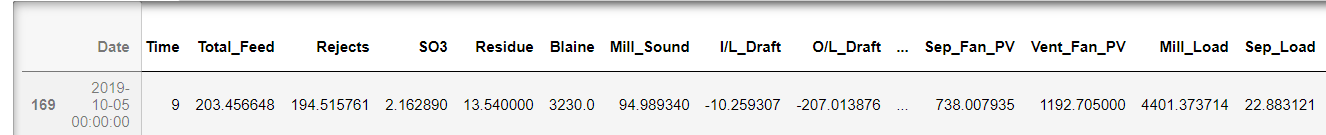
- The Dataset of Raw Mill/ Cement Mill/ Kiln should be pre-processed as per the format. Screenshot reference available in the image below.
- The Features or the columns can be in any order.
- There should be a single header specifying the descriptions of the dependent and independent variables.
- Avoid adding spaces between two words and avoid adding units Eg:- Avoid “Elevator Load” instead try as “Elevator_Load” (This is because the program is designed and standardized to handle most of the dataset from Cement )
- Make sure the Mill Feed or the kiln feed column description should be renamed as “Total_Feed”.
- Before you upload the dataset in the site, rename the dataset, you want to analyze as ‘CementAPCToolKit_RawMill.csv’ or ‘CementAPCToolKit_CoalMill.csv’ or ‘CementAPCToolKit_Kiln.csv’ or ‘CementAPCToolKit_CementMill.csv’
- Browse for the pre-processed dataset by clicking on the Select file button
- Click on Upload
- After successful upload, run the python program by clicking on “Run”
- After then you will be prompted to enter the section of plant for which the dataset needs analysis. Enter them as RawMill or CoalMill or Kiln or CementMill, the same suffix as you just uploaded.
- Enjoy the Analysis.
Note:- If you face issues using this toolkit go to — Contact — Fill the Contact Form, I’ll get back to you! You can also reach out to me by sending your queries on [email protected]
The APC Performance Metrics namely the Total Feed and Specific Power Consumption was computed in Python3.
In this case, I have used Jupyter Notebook for illustration purpose and this code exactly won’t run when executed in Pycharm or Spyder. You need to do little tweaks.
Follow the steps to compute the Probability density function for a dataset:-
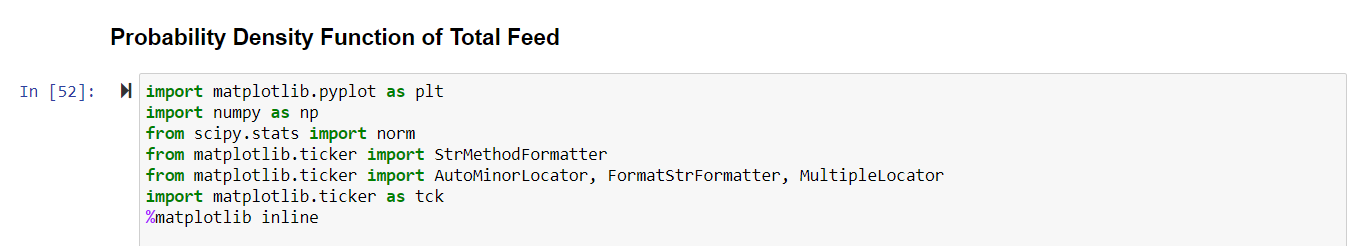
Step:1 Importing the necessary Libraries, pandas, matplotlib and scipy
- Pandas takes care of data manipulation, importing dataset as per your required formats and analysis.
- Matplotlib creates a figure, creates a plotting area in a figure, plots some lines in a plotting area, decorates the plot with labels, etc.
- scipy which is scientific library of python is used to import the “Probability Density Function (pdf)”

Step:2 Importing the Dataset as csv/xlsx/url. Make sure to pre-process the dataset as the per the rules mentioned before uploading the dataset in this site for online analysis!

Step:3 Since you want to understand and analyze the distribution of Total Feed, use sort_values function to sort the “Total_Feed” feature in ascending order.

Step:4 Use the describe() function of pandas to get the summary of your dataset like count, mean, standard deviation, min, max, 25%, 50%, 75%

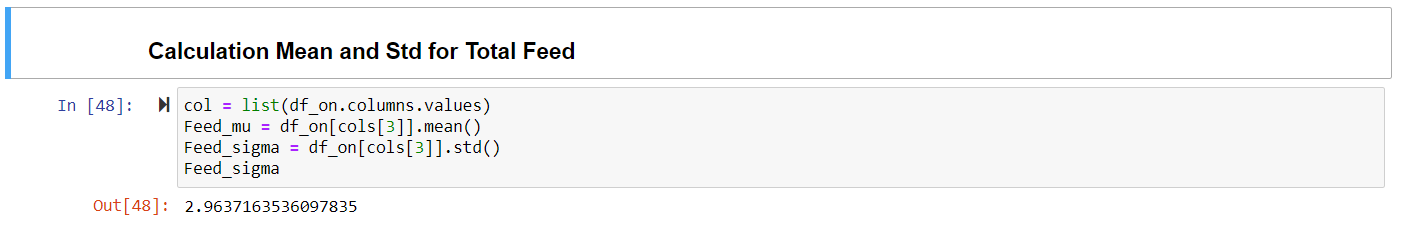
Step:5 The aim is to compute the probability density function as normal distribution. So, computation of Z-score is the preliminary step. Hence compute the mean and Std of the Total_Feed
Step:6 Compute the Z-scores after calculation of Mean and Std. A separate column of Z-scores will be created

Step:7 Since the Total_Feed is already sorted in ascending order you don’t need to sort the Z-scores

Step:8 The updated dataset can be saved using “df.to_excel” function of pandas or “df.to_csv”

Step:9 Make sure to import numpy library. It is used here to plot a high resolution graph and to control the Major and Minor ticks
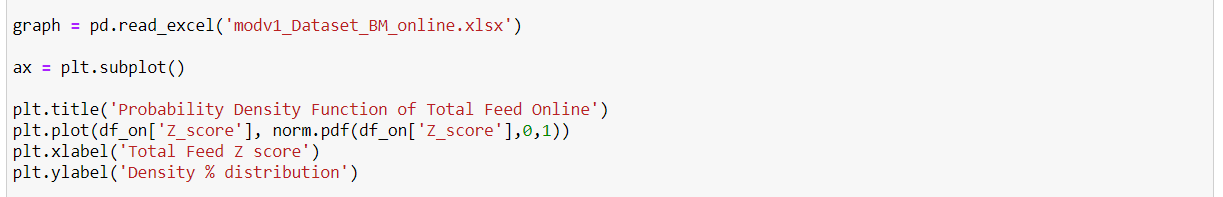
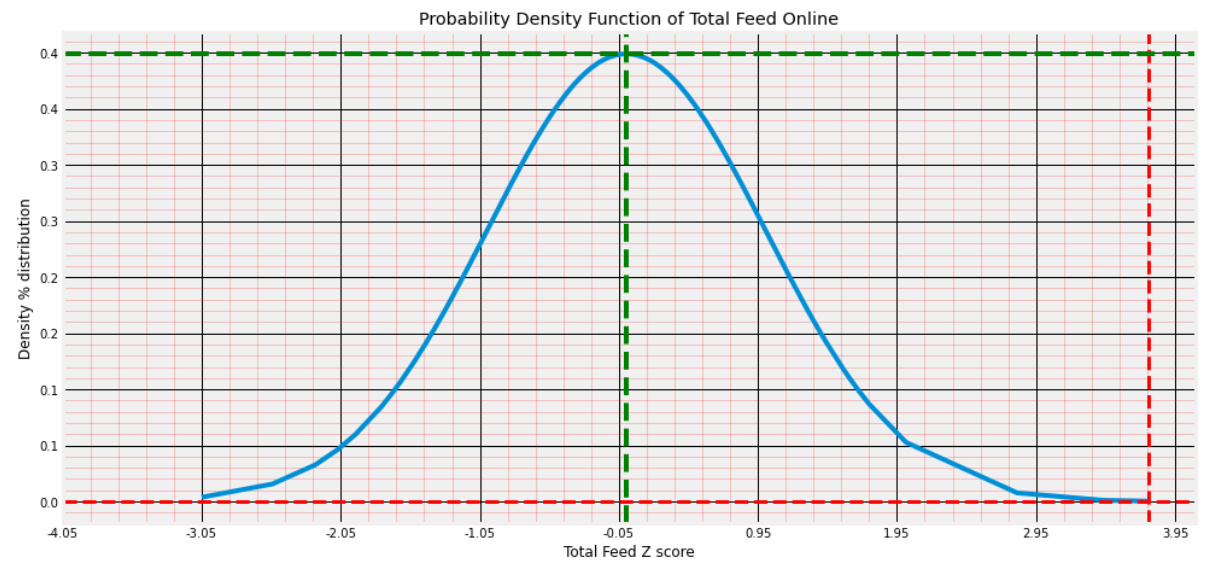
Step:10 Plot the Probability Density Function of Total Feed by calling the pdf function from the norm class under Stats module of Scipy Library.
- Use the plt.plot function to plot in X-axis – Z-scores, Y-axis – pdf(Z-scores)
- Create the X, Y axis labels xlabel and ylabel functions.
Step:11 Draw horizontal and vertical lines to visualize the maximum and mean values of Total Feed. Use axhline and axvline functions respectively.

Step:12
- Use xticks function of matplotlib to Get or set the current tick locations and labels of the x-axis.
- Use numpy arange function to place the Z-score from minimum to maximum in steps of 1 in X-axis.

Step:13 Set the resolution of labels in X and Y axis for major axis of the current plot, using the major_formatter function. {X: , .1f} depicts a resolution of one value after decimal point.

Step:14
- Format the major axis and minor axis grid using the grid function
- Specify the color and linestyle and alpha to change the intensity of color.
- minorticks_on() function plots the minor ticks

Step:14
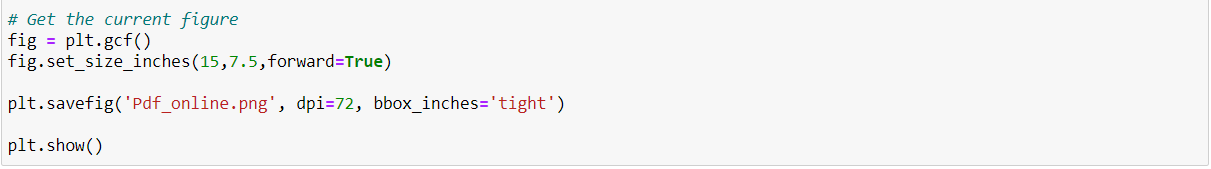
- Return the current plot in fig variable and format the size of plot using set_size_inches() function.
- Use savefig() function to save the current plot.
Probability Density Function of Total Feed and its Z-score density distribution.
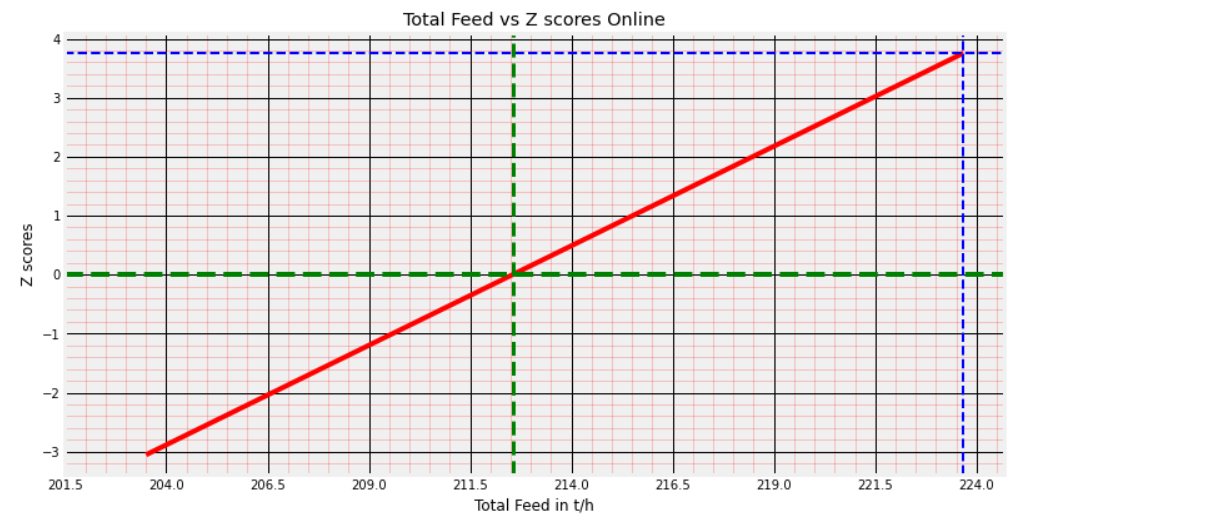
Total Feed vs Z-scores: To trace the % distribution of Total Feed samples from the PDF curve.
Note:- The Tool Kit in Action available in this site was developed in Spyder for users information
Note:- If you face issues using this toolkit go to — Contact — Fill the Contact Form, I’ll get back to you! You can also reach out to me by sending your queries on [email protected]